
From bland to bold: four steps to a memorable chart
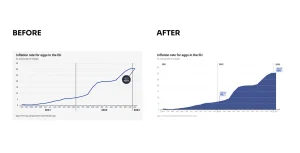
Colin Ware states reading data visualization is a two-step process. It starts with recognizing what questions can be answered and is followed by finding the answer to them.
Colin Ware states reading data visualization is a two-step process. It starts with recognizing what questions can be answered and is followed by finding the answer to them.